

Measuring Results and Understanding Attribution
- View
When a sale has more than one source
A customer sees a bakery’s social media ad, later searches for its name, and finally places an order after receiving an email. Which channel deserves credit for the sale? The answer affects where the bakery spends its marketing budget, but no single number tells the whole story.
Throughout this lesson, we will use an illustrative business called Maple Street Bakery. Its owner wants online cake orders, not just more attention, so marketing reports must connect activity to that goal. The figures in the examples are fictional and designed to show how measurement works.
By the end of this lesson, you will be able to:
-
Choose measurements that match a business goal.
-
Calculate basic marketing performance measures.
-
Explain how attribution models assign credit.
-
Recognize the limits of marketing reports.
Start with the result the business needs
Maple Street Bakery receives 5,000 social media likes, but its owner cannot use likes to pay suppliers. A completed cake order is a more direct sign of business value. This illustrates the difference between a metric, any measured quantity, and a key performance indicator (KPI), a metric selected to judge progress toward a specific goal.
A conversion is a valuable action that a business chooses to track, such as a purchase or a completed inquiry form. A conversion is not always a sale: a catering inquiry may create an opportunity without producing revenue yet. For the bakery’s online ordering campaign, the primary conversion is a completed, paid cake order.
Supporting metrics help explain how people reach that result. Impressions, the number of times content appears, show exposure, while clicks show responses to a link. These measures are useful for finding problems, but they should not replace the main business result. A campaign can attract many clicks and still produce few orders.
| Measurement question | Useful metric | What it does not prove |
|---|---|---|
| Did people have a chance to see the ad? | Impressions | That they noticed or remembered it |
| Did people follow the link? | Clicks | That they wanted to buy |
| Did visitors complete an order? | Purchase conversions | That marketing caused every order |
| Did attributed sales justify ad spending? | Return on ad spend | That the campaign made a profit |
A clear measurement plan connects a goal, a conversion, and a reporting period. For example, “Generate 20 paid online cake orders during June” is easier to evaluate than “Improve our marketing.” Supporting metrics then help explain the result rather than distract from it.
Turn campaign numbers into useful measures
Suppose the bakery spends $300 on advertising, receives 200 ad clicks, and records 10 orders attributed to those ads. Those orders produce $800 in revenue. The raw totals show activity, but ratios make the relationship between cost and results easier to understand.
Cost per click (CPC) shows average ad spending per click, while cost per acquisition (CPA) shows average spending per chosen acquisition. Here, an acquisition means a paid order; other businesses may define it differently. Return on ad spend (ROAS) compares attributed revenue with ad spending, not with every cost of running the business.
| Measure | Calculation | Bakery result |
|---|---|---|
| CPC | Ad spending ÷ ad clicks | $300 ÷ 200 = $1.50 |
| Click-to-order conversion rate | Attributed orders ÷ ad clicks × 100 | 10 ÷ 200 × 100 = 5% |
| CPA | Ad spending ÷ attributed orders | $300 ÷ 10 = $30 per order |
| ROAS | Attributed revenue ÷ ad spending | $800 ÷ $300 = 2.67, or 2.67:1 |
The denominator—the number below the division line—must stay clear. A conversion rate based on clicks is not directly comparable with one based on website visits, because a click does not always become a recorded visit. Similarly, a $30 CPA means little until the business considers order value and costs. If each order leaves only $20 after ingredients, packaging, and delivery but before advertising, paying $30 to acquire it loses money on that first order.
A high ROAS is not the same as profit. In this example, $800 in revenue minus $300 in advertising leaves $500 before other costs. The bakery needs those additional costs to judge profitability, so ROAS is one part of the decision rather than a complete financial answer.
Make sure the report measures real actions
A customer completes an order, and the website sends a purchase record to its analytics system, which collects and reports activity. That record is an event, a tracked action such as a purchase or form submission. If the event fires twice for one order, the report can make performance look better than it is. Good measurement therefore starts with a clear definition of what counts and a check that it is recorded correctly.
Campaign tracking identifies where visits come from. One common method uses UTM parameters, labels added to a link to identify its source, medium, and campaign. For example, a bakery email link might use utm_source=newsletter, utm_medium=email, and utm_campaign=june_cakes. Consistent labels help keep one campaign from appearing as several unrelated entries.
A simple checking process connects marketing records with business records:
- Define the action: Use “successful paid order” as the input definition, producing one clear conversion rule.
- Check a test order: Compare one completed order with its purchase event, producing confirmation that the action records once.
- Check a campaign link: Open the labeled email link and inspect the recorded source, producing confirmation that the campaign is identified correctly.
- Match reporting settings: Use June dates, the same time zone, and the same currency, producing a consistent reporting basis.
- Compare totals: Check reported purchases against the order system, producing a list of differences to investigate.
Perfect agreement is not always possible. Consent choices, blocked tracking, refunds, and different reporting dates can create gaps. If analytics shows 18 purchases while the order system shows 20, the first response should be investigation—not an automatic decision to increase or cut the budget.
Attribution assigns credit, not certainty
One Order, Different Credit Rules
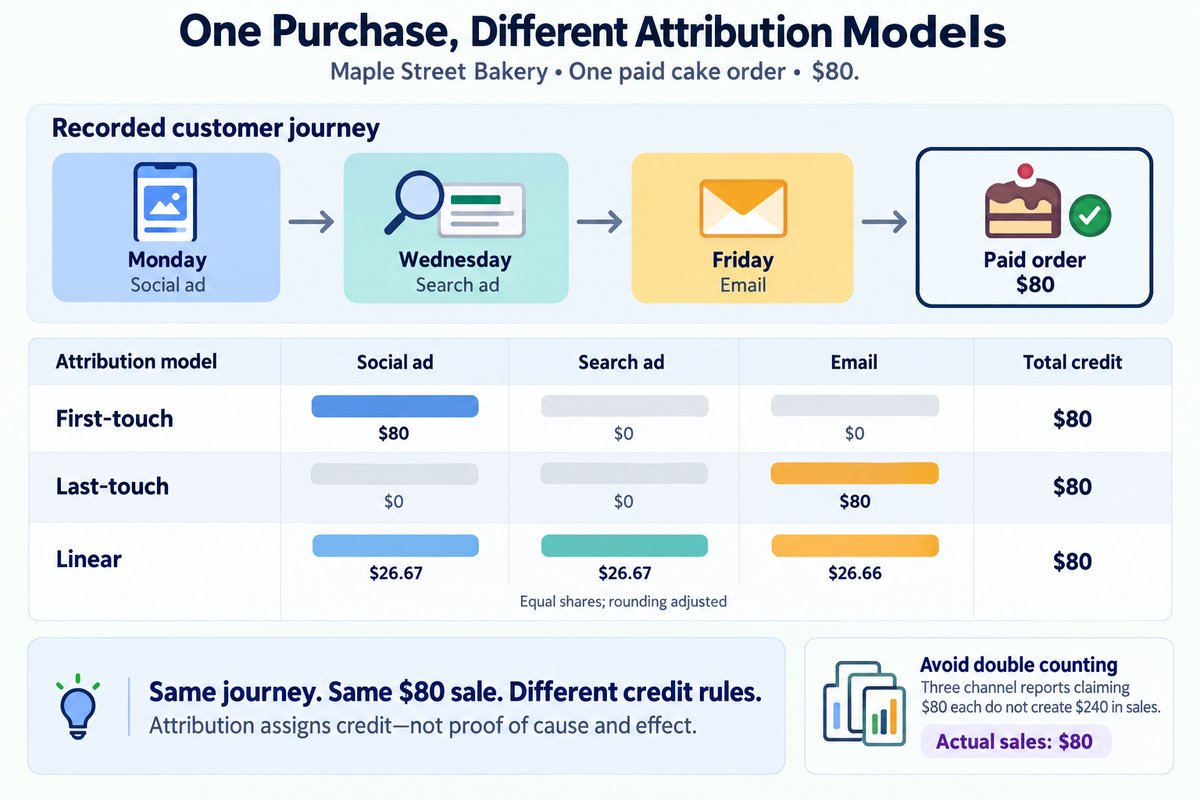
One customer clicks a social ad on Monday, clicks a search ad on Wednesday, and follows an email link before buying on Friday. These interactions are touchpoints, recorded contacts between a customer and marketing. Attribution is the method used to assign conversion credit to those touchpoints. It helps explain the recorded path to a purchase, but it does not reveal every influence on the customer.
An attribution model is the rule used to distribute that credit. The table shows how three simple models treat the same $80 order. The customer journey stays the same; only the credit rule changes. These are useful teaching models, though individual reporting platforms may offer different options.
| Comparison point | First-touch attribution | Last-touch attribution | Linear attribution |
|---|---|---|---|
| Credit rule | All credit goes to the first eligible touchpoint | All credit goes to the last eligible touchpoint | Credit is shared equally across eligible touchpoints |
| Credit for the bakery order | Social ad: $80 | Email: $80 | Each channel: about $26.67, with rounding adjusted |
| Main use | Highlights discovery | Highlights the final recorded interaction | Shows a shared journey |
| Main limitation | Ignores later support | Can hide earlier influence | Assumes equal contribution |
Reports also use a lookback window, the period before a conversion during which interactions can qualify for credit. With a 30-day window, an ad click 35 days before purchase generally falls outside that window. Some systems also exclude certain touchpoints under their credit rules, so “last touch” needs a clear definition.
Most importantly, attribution is not proof of cause and effect. A customer might have ordered even without the email, or an untracked recommendation might have shaped the decision. Reports can also miss activity across devices or count the same sale in more than one platform. Attribution supports budget decisions, but it should not be treated as a complete record of customer motivation.
Example: Is a lower cost per order really better?
Maple Street Bakery reviews two illustrative campaigns for the same month. Both use the same purchase definition, attribution model, and reporting window. The owner first checks these settings so the comparison has a consistent basis.
| Measure | Social ad campaign | Search ad campaign |
|---|---|---|
| Ad spending | $300 | $300 |
| Attributed paid orders | 10 | 15 |
| Attributed revenue | $800 | $600 |
| CPA | $30 | $20 |
| ROAS | 2.67:1 | 2:1 |
- Use spending and orders: Divide $300 by each campaign’s orders, producing CPAs of $30 and $20.
- Use revenue and spending: Divide each campaign’s revenue by $300, producing ROAS figures of 2.67:1 and 2:1.
- Add order costs: Check ingredients, packaging, and delivery costs, producing a clearer view of money left after advertising.
Search produces more orders at a lower CPA, while social produces more revenue from the same spending. That does not establish one universal winner: the campaigns attract orders of different average values. The owner shares the results with the person managing order costs before changing the budget. This connects marketing reporting with business decisions, while recognizing that small totals and attribution limits make a large budget shift risky.
Example: Why three reports can claim one sale
The bakery’s $80 customer journey includes a social ad click, a search ad click, and an email click before purchase. Suppose each channel’s reporting system recognizes its own interaction and claims full credit under its rules. Adding those reports produces $240 in claimed revenue, even though the order system contains one $80 sale. This is double counting: counting the same outcome more than once.
The owner checks the journey in a shared analytics report that applies one attribution model across recorded channels. A last-touch model gives the email the full $80, while a linear model divides it across the three eligible interactions. Neither model creates new revenue; each offers a different view of the same purchase. The benefit is a more consistent basis for discussion, although missing tracking can still leave the journey incomplete.
- Start with the order record: Confirm one paid $80 order, establishing the actual sales total.
- Review channel claims: Identify three $80 claims, revealing overlap rather than three separate sales.
- Apply one reporting rule: Use the selected shared model, producing a consistent allocation of that $80.
- Record the limitation: Note that credit does not prove necessity, producing a cautious interpretation for the budget review.
A clearer basis for decisions
-
Connect marketing goals to meaningful conversions, not attention alone.
-
Use rates and cost measures with clear definitions, consistent settings, and business costs.
-
Check tracking before treating a report as reliable evidence.
-
Read attribution as an allocation of credit, not proof that a channel caused a sale.
Reliable measurement connects digital marketing activity to business results. You do not need a perfect record of every customer interaction to make useful decisions. Clear definitions, careful checks, and honest limits give you a stronger basis for deciding what to continue, investigate, or change.